
El desmantelamiento de la represa Marmot en Oregon
.
.
An Example of One River's Response to a Large Dam Removal.
.
Muchas represas se encuentran en EEUU en proceso de renovación de licencias, tiempo durante el cual, las ventajas y desventajas particulares de una represa se sopesan. Durante el proceso de renovación de licencias, se decidió que los costos asociados con el mantenimiento y mejora de la represa Marmot eran superiores a los beneficios que generaría y se decidió eliminarla.
Este es entonces un buen ejemplo de que una forma de mitigar los efectos negativos de las represas es ELIMINARLAS. El desmantelamiento de la represa Marmot en Oregon es parte de la nueva política de los EEUU para recuperar sus ríos, ya que los ríos vivos valen más que los represados a la hora que se hace un verdadero balance de los pros y los contras.
El desmantelamiento de la represa Marmot en Oregon
Descripción
Represar un río puede proporcionar energía eléctrica, almacenamiento de agua, y / o control de inundaciones, pero al mismo tiempo puede tener efectos adversos sobre los peces y otras especies acuáticas, inunda la tierra aguas arriba de la represa, y degrada el río aguas abajo de la represa. Muchas represas se encuentran en EEUU en proceso de renovación de licencias, tiempo durante el cual, las ventajas y desventajas particulares de una represa se sopesan. Una forma de mitigar los efectos negativos de las represas es eliminarlas. Sin embargo, la eliminación de represas puede ser problemática, especialmente cuando hay sedimentos almacenados detrás de la represa, que se erosiona y se arrastra aguas abajo.
Represa Marmot
El monitoreo del desmantelamiento de la represa de Marmot en Oregon en 2007, una represa de 15 m de altura en el río Sandy River (Figura 1), fue estudiado para examina los efectos de la eliminación de la represa y la liberación de sedimentos almacenados. Durante el proceso de renovación de licencias, se decidió que los costos asociados con el mantenimiento y mejora de la represa Marmot eran superiores a los beneficios que generaría y se decidió eliminarla. En el momento de demolerla, la represa tenía 94 años de edad, es el caso de una de las represas más altas y más grandes (en términos de sedimentos almacenados) desmanteladas en los Estados Unidos. La documentación de la respuesta del río a la destrucción de la represa proporciona información valiosa para eventuales eliminaciones de grandes represas en el futuro. Ofrecemos una breve descripción de los esfuerzos de monitoreo en el río Sandy River cerca de la represa Marmot. Las técnicas de recolección de datos se detallan en otro informe.
Sedimentos
Los ríos acarrean agua y sedimentos [fragmentos de roca, tales como arena y grava], y las represas afectan al transporte y almacenamiento de ambos. Nuestro río transporta sedimentos y arena que varían en tamaños desde fracciones de milímetro a medio metro o más. Estos granos de sedimento se llevan suspendidos en la columna de agua [la carga suspendida] y a lo largo del lecho fluvial [carga de fondo]. A medida que la carga suspendida y carga de fondo de un río llega a las aguas más lentas y más profundas del embalse en la represa, algunas o todas las partículas dejan de moverse y se depositan. Durante la vida de la represa Marmot, aproximadamente 750.000 m3 de sedimentos quedaron acumulados detrás de la represa, llenando casi hasta el borde el embalse. En el momento de la destrucción de la represa, se calculó que esta cantidad de sedimento equivalía a entre 5 y 20 veces la cantidad de sedimentos que el río trasladaba cada año. El sedimento acumulado podría verse a lo largo de 2,5 km aguas arriba, colmatando los 15 m de fondo de la represa. Una vez que la represa se retiró, este depósito de sedimentos fue de nuevo objeto de transporte por el río, y tenía el potencial de cambiar radicalmente el carácter del río.
La erosión aguas arriba
El proceso de eliminación de la represa implicó la construcción de una ataguía pequeña [dique temporal] 70 metros aguas arriba de la represa, la eliminación de la represa de concreto se efectuó con maquinaria pesada, dejando sólo la ataguía sobre el sedimento acumulado, y luego se voló el dique o ataguía cuando aumentó el caudal de agua con la llegada del invierno. La erosión comenzó inmediatamente después de la voladura el 19 de octubre de 2007. En cuestión de horas, el río había cortado varios metros a través de la ataguía y en el embalse. Aunque la respuesta inicial fue la incisión [corte del río a través de los sedimentos], el río rápidamente fue migrado lateralmente [iba y venía erosionando los bancos] y despejaba el sedimento en el sitio de la antigua represa trasladándolo de banco a banco (Figura 2). Un perfil longitudinal del río [ elevación vs dirección corriente abajo] muestra la progresión de la erosión aguas arriba (Figura 3). Esta erosión se produjo por una combinación de tres procesos: la incisión, la migración lateral, y la erosión escalonada de sedimentos. El un mes, el 25% del depósito de sedimentos había sido erosionado, y al final del primer año el 50% había sido erosionado. Dos años después de que la represa se retiró, el río tenía un ancho parejo y depósitos parecidos a los de antes de la represa, pero el lecho estaba algo colmatado.
Deposición aguas abajo
Gran parte del sedimento erosionado no fue lejos. Como resultado del acarreo de sedimentos del embalse, el lecho del río inmediatamente aguas abajo de la antigua represa retuvo sedimentos y aumento de altura, hasta 4 m. El río cambió de un río de un solo canal a uno de múltiples canales, debido a los sedimentos depositados (Figura 4). Al final de la primera temporada de lluvias, el sedimento inmediatamente debajo de la represa quedó estabilizado en una nueva barra grande y el río volvió a entrar en una configuración de un solo canal. Los sedimentos pequeños (<2 mm) se trasladaron por el río como carga suspendida. Gran parte de los sedimentos más grandes (2 mm-20 cm) se depositaron en los 2 km, inmediatos corriente abajo de la represa. Muy cerca de la represa, los sedimentos depositados de manera uniforme a través del río; en secciones transversales formaron gradas a todo lo ancho del cauce (Figura 5). Sin embargo, más abajo el sedimento quedó depositado menos uniformemente - principalmente en la parte superior de los nuevos bancos de grava. La mayoría de las actividades de supervisión se centró en la parte del río próxima a la represa, donde los cambios fueron más grandes; inspecciones anuales a 14 y 20 km río abajo de la represa no encontraron cambios en los dos años siguientes al retiro de la represa.
Observaciones generales
La eliminación la represa Marmot brindó la oportunidad de monitorear la respuesta de una parte del río Sandy River a un aumento repentino en el sedimento que acarreaba. El lecho del depósito mostró tres procesos de erosión - incisión, ampliación, y la migración escalonada. El depósito aguas abajo varió en función del tamaño de grano y la proximidad a la represa. Gran parte del sedimento se estabilizó con rapidez en el lecho, cerca de la represa. En el resto del río no hubo cambios mensurables en el lecho del río. Esta respuesta es similar a las predicciones antes de la eliminación mediante un modelo numérico de transporte de sedimentos (Cui y Wilcox, 2008). El seguimiento de los proyectos de varios años ha documentado cómo el río Sandy River ha procesado la gran cantidad de sedimentos que se le han presentado por la eliminación de la represa Marmot y deben ayudar a tomar futuras decisiones al eliminar represas.
--------------------------------------------------------------------
For more information and to follow the progress of the removal visit the Marmot Dam website. An illustration of key steps in the removal process is provided below.
Marmot Dam: Before and After
.
-
Figure 1: Paired photographs taken from the same location 50 m below the dam site looking upstream (A & B) and downstream (C & D) before removal (A & C) in July 2007 and after removal (B & D) in July 2009. In the July 2007 photo (A) Marmot Dam is still in place and heavy equipment is constructing the cofferdam. The road visible on the right side of the downstream pre-removal photo (C) has been buried by several meters of sediment in the post-removal photo (D).
Initial Erosion of Marmot dam
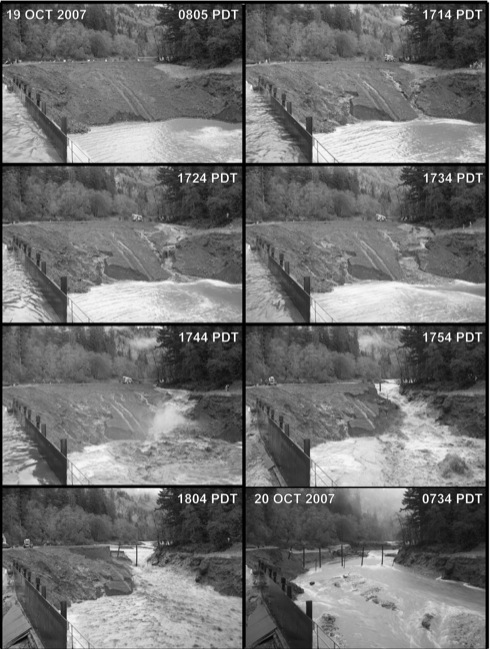
Figure 2: Time lapse photographs of the first 14 hours of erosion. The concrete dam has already been removed and the cofferdam is visible in the photograph. The breaching is being initiated in the 1714 PDT photo by a forklift carving a small notch in the top of the cofferdam.
Longitudinal Profile
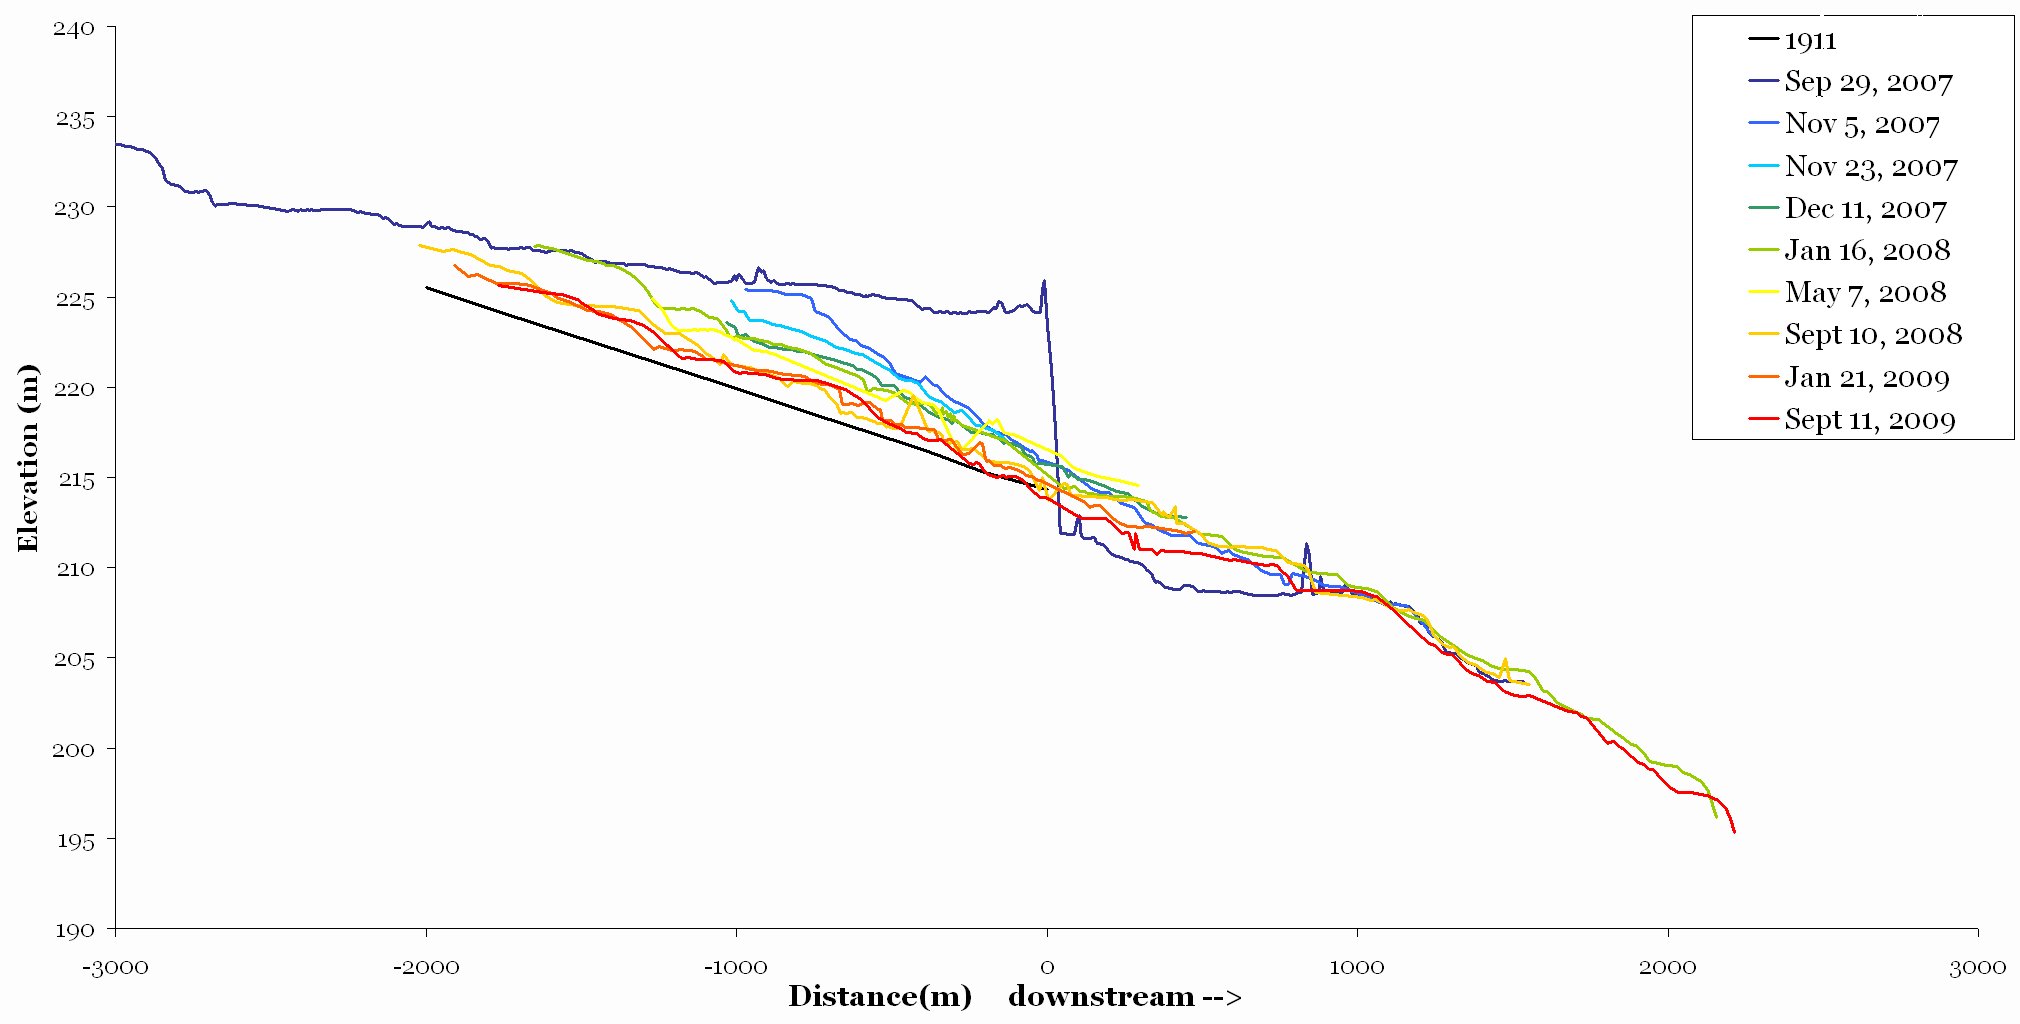
View Original Image at Full SizeFigure 3: Longitudinal profiles of the water surface elevation from 2 km upstream to 2 km downstream of the dam site showing changes in the channel profile through time. The long profile from 1911 is reconstructed from a pre-construction plan. Notice the upstream progression of the erosion and the deposition immediately below the dam
Planform Development
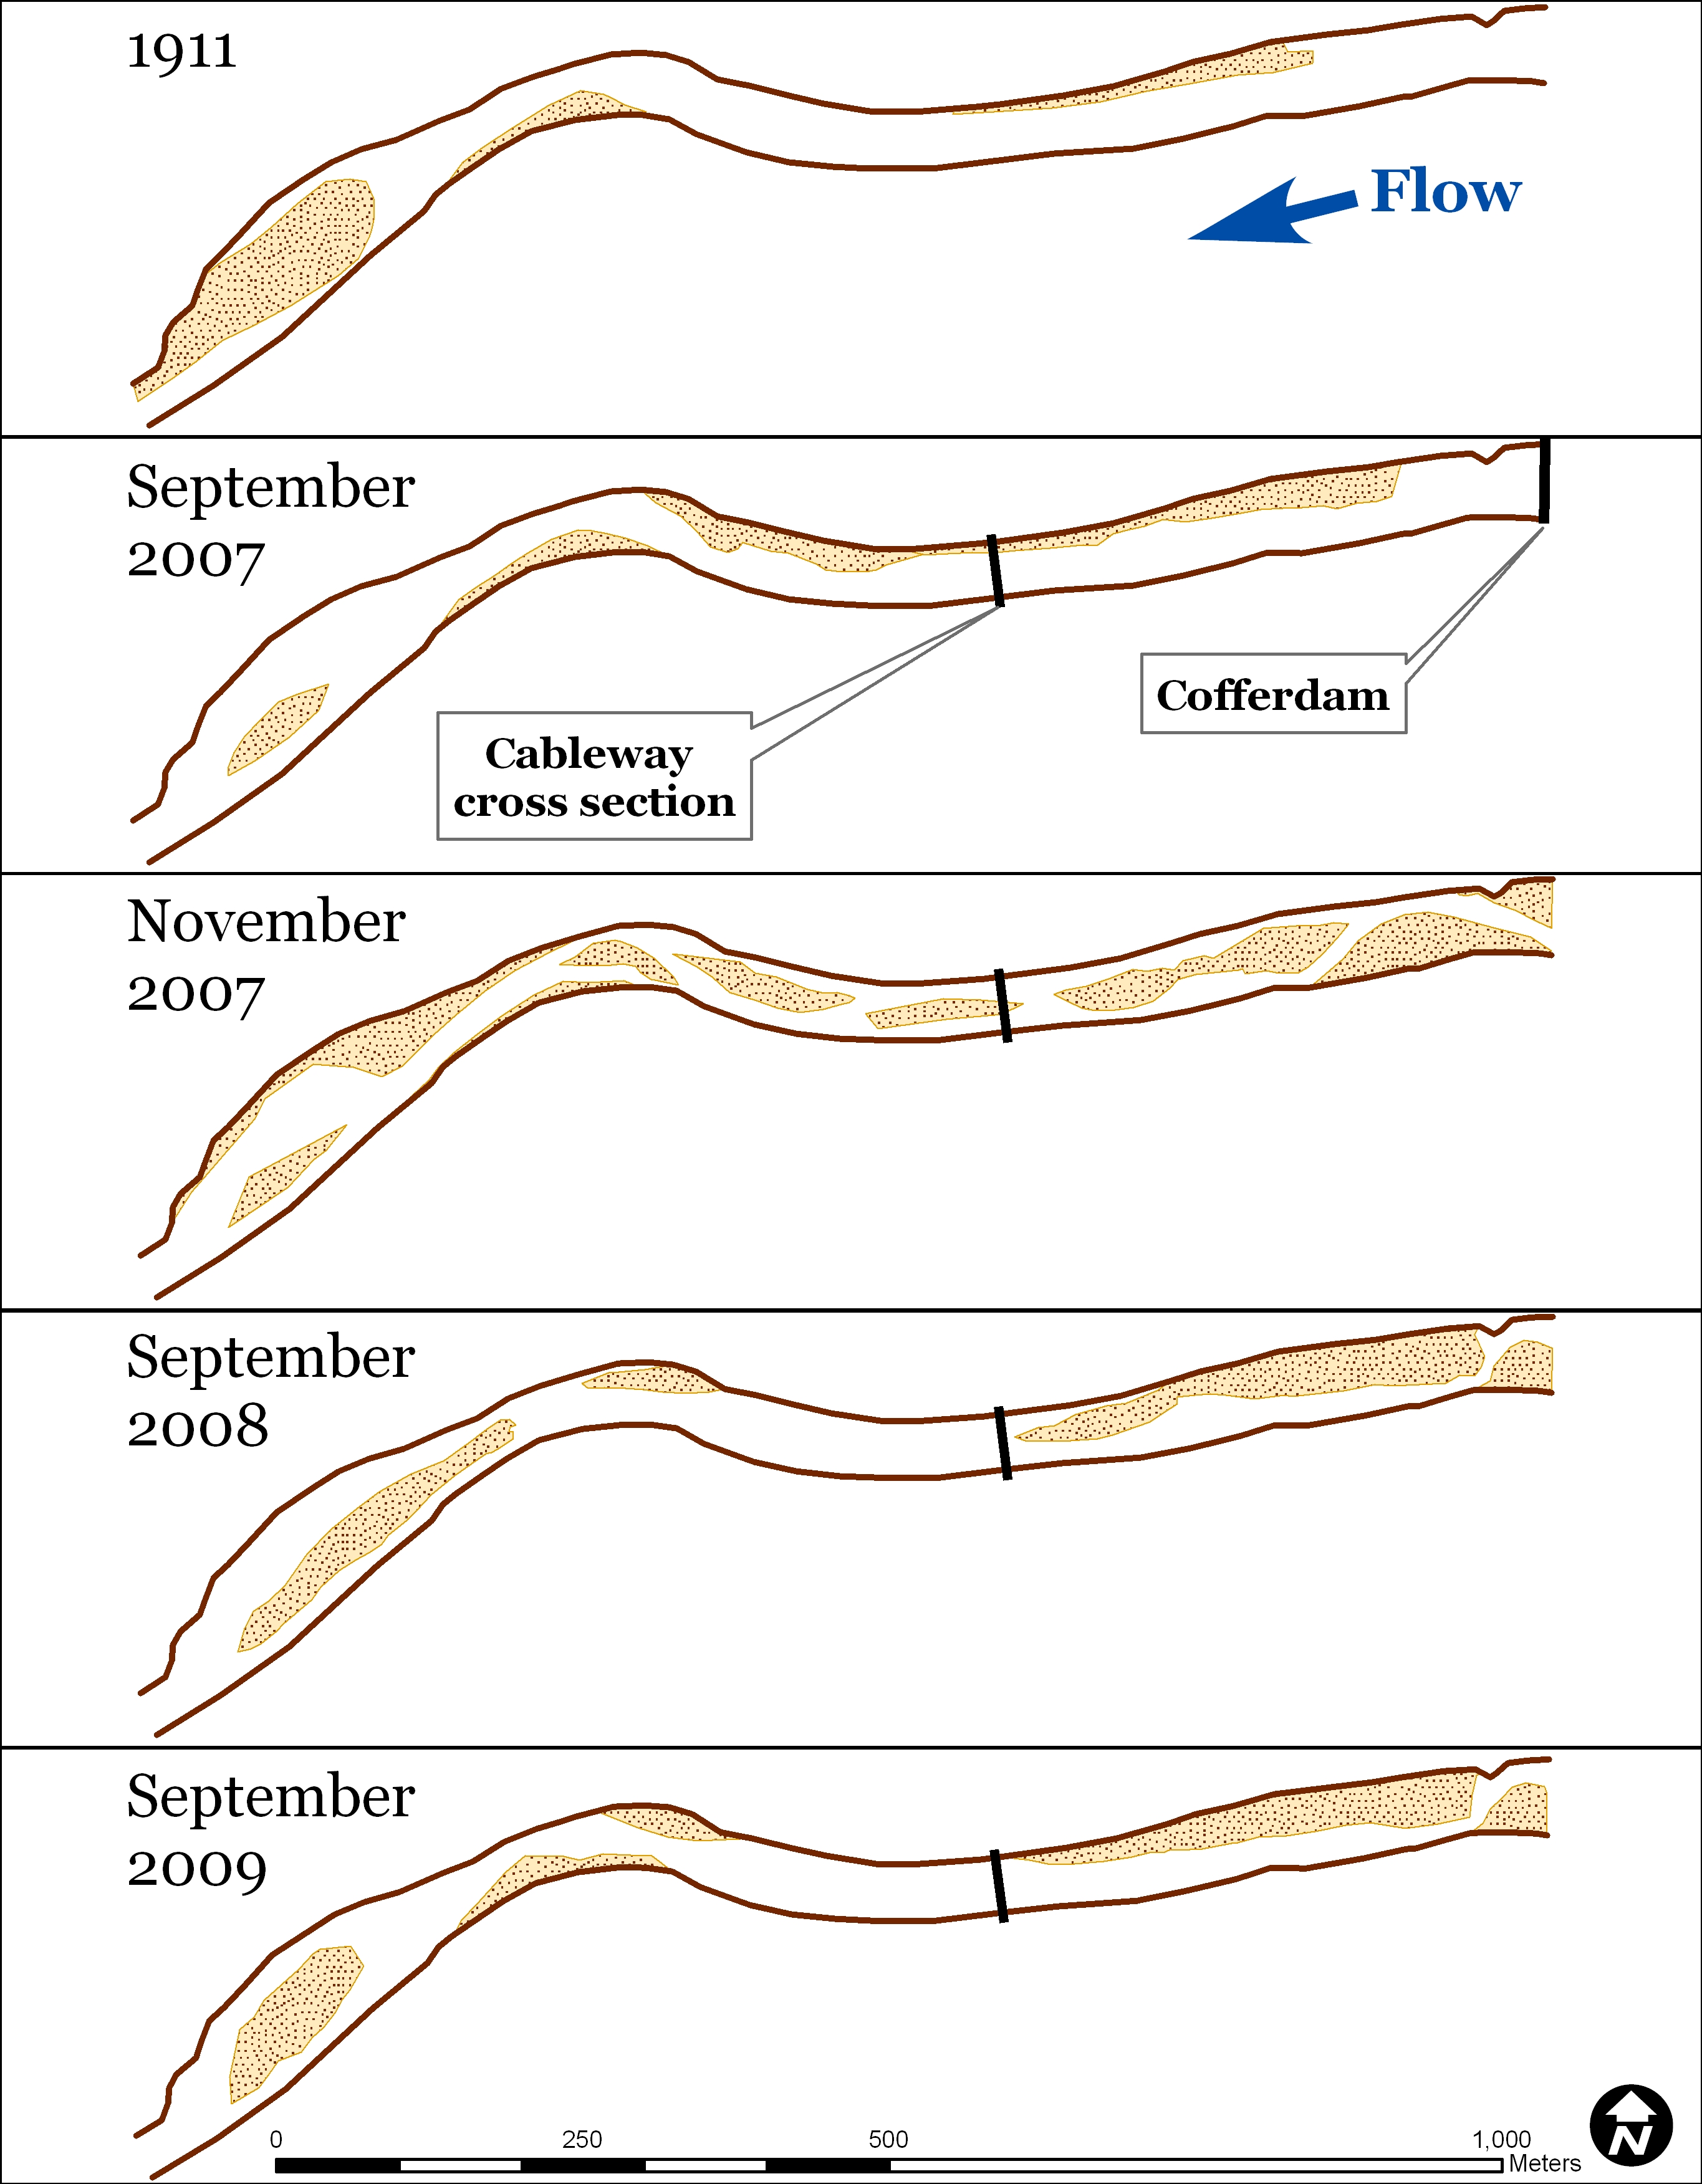
View Original Image at Full SizeFigure 4: Development of river bar planform [2-D viewed from above] over time. The dark brown lines were traced from the water's edge visible in September 2008 aerial photographs to serve as a common reference. The temporary transition to a multiple-channel planform is evident in the November 2007 survey. The cableway cross section is the location of the cross sections in Figure 5.
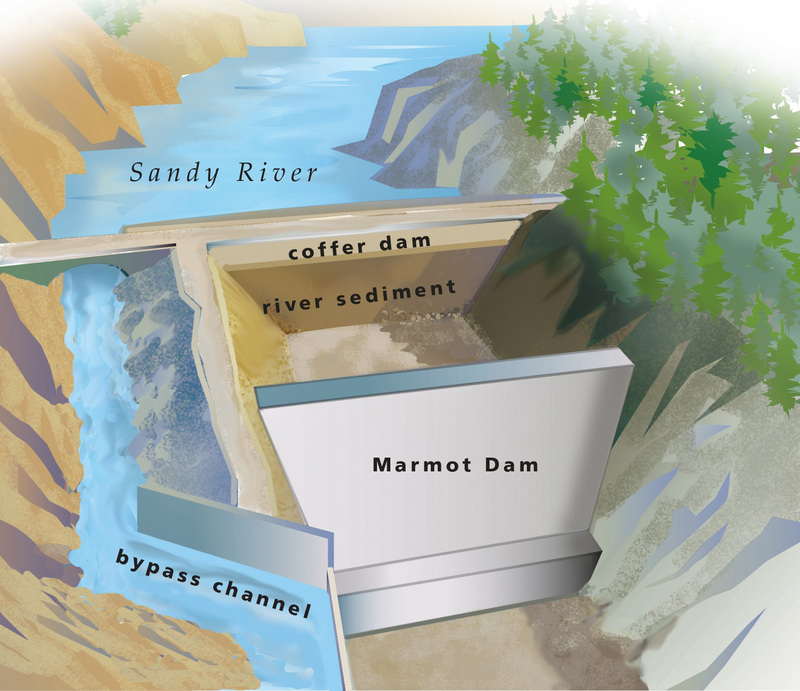
To remove Marmot Dam a coffer dam is constructed to divert the river around the dam structure. The dam can then be removed.
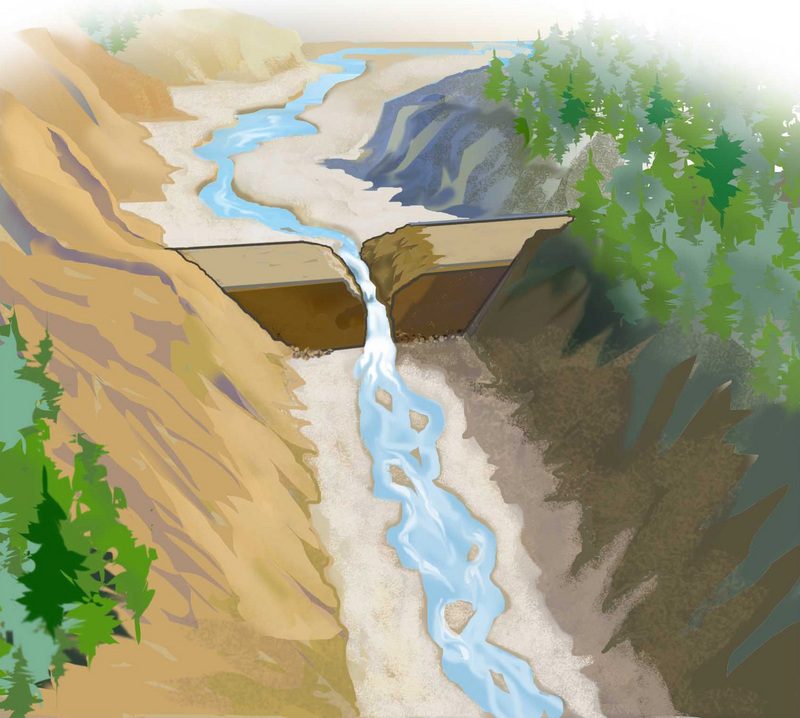
Following removal of Marmot Dam, the temporary coffer dam will be naturally eroded as flows increase during the fall.

A restored Sandy River following removal of Marmot Dam.
---------------------
An Example of One River's Response to a Large Dam Removal
Charles Podolak
Johns Hopkins University, Geography Environmental Engineering
Jon Major, Mackenzie Keith, Jim O'Connor, Rose Wallick
US Geological Survey
Shortcut URL: http://serc.carleton.edu/39733
Location
Continent: North America
Country: United States
State/Province:Oregon
City/Town: Sandy
UTM coordinates and datum: 10N 567913 5027715 (NAD 83)
Setting
Climate Setting: Humid
Tectonic setting: Continental Arc

Figure 1: Paired photographs taken from the same location 50 m below the dam site looking upstream (A & B) and downstream (C & D) before removal (A & C) in July 2007 and after removal (B & D) in July 2009. In the July 2007 photo (A) Marmot Dam is still in place and heavy equipment is constructing the cofferdam. The road visible on the right side of the downstream pre-removal photo (C) has been buried by several meters of sediment in the post-removal photo (D). Created by the author of the page containing this file.
Description
Damming a river can provide hydropower, water storage, and/or flood control, but at the same time may have adverse effects on fish and other aquatic species, flood land behind a dam, or degrade a river downstream of a dam. Many dams are undergoing a required relicensing process, during which time a dam's particular advantages and disadvantages are weighed. One way to mitigate the negative effects of dams is to remove them. However, dam removal itself can be problematic, especially when dealing with sediment stored behind the dam, which erodes and moves downstream.
Marmot Dam
The monitoring of the 2007 removal of Oregon's 15-m-tall Marmot Dam from the Sandy River (Figure 1), is a case study that examines the effects of removing a dam and releasing stored sediment. During the relicensing process, it was decided that the costs associated with maintaining and upgrading the Marmot Dam were higher than the benefits it generated and it was selected for removal. At the time of its removal, the 94-year-old dam was one of the tallest, and largest (in terms of stored sediment) dams to be removed in the United States. Documenting the response of the Sandy River provides valuable information for future large dam removals. This vignette provides a short description of the monitoring efforts on the Sandy River near the Marmot Dam. The data collection techniques are detailed in another vignette: (Sediment) Accounting 101: An Example.
Sediment
Rivers carry water and sediment [rock fragments such as sand and gravel], and dams affect the transport and storage of both. The Sandy River transports sediment ranging in sizes from fractions of a millimeter to half of a meter or larger. These sediment grains are carried suspended in the water column [suspended load] and along the bed of the river [bedload]. As the suspended load and bedload of a river encounter the slower, deeper water behind a dam, some or all of the particles stop moving and deposit on the river bed. Over the life of Marmot Dam, approximately 750,000 m3 of sediment had accumulated behind the dam, filling it nearly to the brim. At the time of removal, it was believed that this amount of sediment was roughly equivalent to 5-20 times the amount of sediment the river moved annually. The impounded sediment could be visualized as a 2.5 km long upstream-tapering wedge 15 m thick at the dam. Once the dam was removed, this reservoir sediment was once again subject to transport by the river, and had the potential to dramatically change the character of the Sandy River.
Upstream Erosion
The dam removal process involved constructing a small cofferdam [temporary dam] 70 meters upstream of the dam, removing the concrete dam with heavy equipment, leaving just the cofferdam atop the impounded sediment, and then breaching the cofferdam as the winter high flows arrived. Erosion started immediately upon its breaching on October 19, 2007. Within hours, the river had cut down several meters through the cofferdam and into the reservoir deposit. While the initial response was incision [the river cutting down through the sediment], the river rapidly migrated laterally [moved back and forth eroding banks] and cleared the sediment at the former dam site from bank to bank (Figure 2). A longitudinal profile of the river [elevation plotted versus downstream direction] shows the upstream progression of erosion (Figure 3). This erosion occurred by a combination of three processes: incision, lateral migration, and knickpoint migration [the moving upstream of a steep break, or step, in the bed slope]. Within one month, 25% of the reservoir sediment had been eroded, and by the end of the first year 50% had eroded. Two years after the dam was removed, the river had a similar width and similar banklines to its pre-dam state, but the bed elevation was still slightly higher than it was before the river had been dammed.
Downstream Deposition
Much of the eroded sediment did not travel far. As a result of the sediment released from the reservoir, the bed of the river immediately downstream of the former dam aggraded [increased in elevation] by as much as 4 m. The river initially changed from a single-channel river to a multiple-channel one due to the sediment introduced from upstream (Figure 4). By the end of the first wet season, the sediment immediately below the dam stabilized into one new large bar and the river went back into a single-channel configuration. The small sediment sizes (<2 mm) moved down the river as suspended load. Much of the larger sediment (2 mm-20 cm) was deposited in the 2 km immediately downstream of the dam. Very near the dam, the sediment deposited uniformly across the river; cross sections show this section-wide aggradation (Figure 5). However, farther downstream the sediment deposited less uniformly--primarily on top of existing gravel bars. Most of the monitoring effort focused on the reach [portion of the river] near the dam, where the large changes occurred; annual surveys 14 and 20 km below the dam failed to show change in the two years after the dam was removed.
Overall Observations
The Marmot Dam removal provided an opportunity to monitor the response of a portion of the Sandy River to a sudden increase in the sediment supplied to it. The reservoir bed showed three erosion processes--incision, widening, and knickpoint migration. The downstream deposition differed based on grain size and proximity to the dam. Much of the sediment quickly stabilized into the bed near the dam. Over the remainder of the river there was no measurable change in the river bed. This response is similar to pre-removal predictions using a numerical sediment transport model (Cui and Wilcox, 2008). The multi-year monitoring project has documented how the Sandy River has processed the large amount of sediment that was made available to it by the removal of the Marmot Dam and should help inform future dam removal decisions.
Associated References
Cheng, F., and Granata, T., 2007, Sediment transport and channel adjustments associated with dam removal: field observations: Water Resources Research, v. 43, W03444, doi:10.1029/2005WR004271, 14 p.
Cui, Y., and Wilcox, A., 2008, Development and application of numerical models of sediment transport associated with dam removal, in Garcia, M.H., ed., Sedimentation Engineering--Processes, Measurements, Modeling, and Practice.American Society of Civil Engineers Manuals and Reports on Engineering Practice no. 110, p. 995-1020.
Doyle, M.W., Stanley, E.H., and Harbor, J.M., 2003a, Channel adjustments following two dam removals in Wisconsin: Water Resources Research, v. 39, no. 1, 1011, doi:10.1029/2002WR001714, 15 p.
Doyle, M.W., Stanley, E.H., Harbor, J.M., and Grant, G.E., 2003d, Dam removal in the United States: Emerging needs for science and policy: EOS, Transactions American Geophysical Union, v. 84, p. 29, 32-33.
Heinz Center, 2002, Dam removal--science and decision making. The H. John Heinz Center for Science, Economics, and the Environment, 221 p.
Major, J.J., O'Connor, J.E., Grant. G.E., Spicer, K.R., Bragg, H.M., Rhode, A., Tanner, D.Q., Anderson, C.W., Wallick, J.R., 2008, Initial fluvial response to the removal of Oregon's Marmot Dam: EOS, Transactions American Geophysical Union, v. 89, no. 27, p. 241-242.
National Inventory of Dams, 2007, US Army Corps of Engineers. https://nid.usace.army.mil/. accessed 1 Dec 2009.
O'Connor, J., Major, J., and Grant, G., 2008, The dams come down--unchaining U.S. rivers: Geotimes, v. 53, no. 3, p. 22-28.
Pizzuto, J., 2002, Effects of dam removal on river form and process: BioScience, v. 52, p. 683-691.
Stillwater Sciences (2000), Numerical Modeling of Sediment Transport in the Sandy River, OR Following Removal of Marmot Dam, Technical Report, prepared for Portland General Electric, Berkely, CA. available online at: http://www.stillwatersci.com/publications.php
Websites for more Marmot dam Information:
Johns Hopkins University/National Center for Earth-surface Dynamics: http://www.jhu.edu/marmot/
US Geological Survey: http://or.water.usgs.gov/projs_dir/marmot/index.html
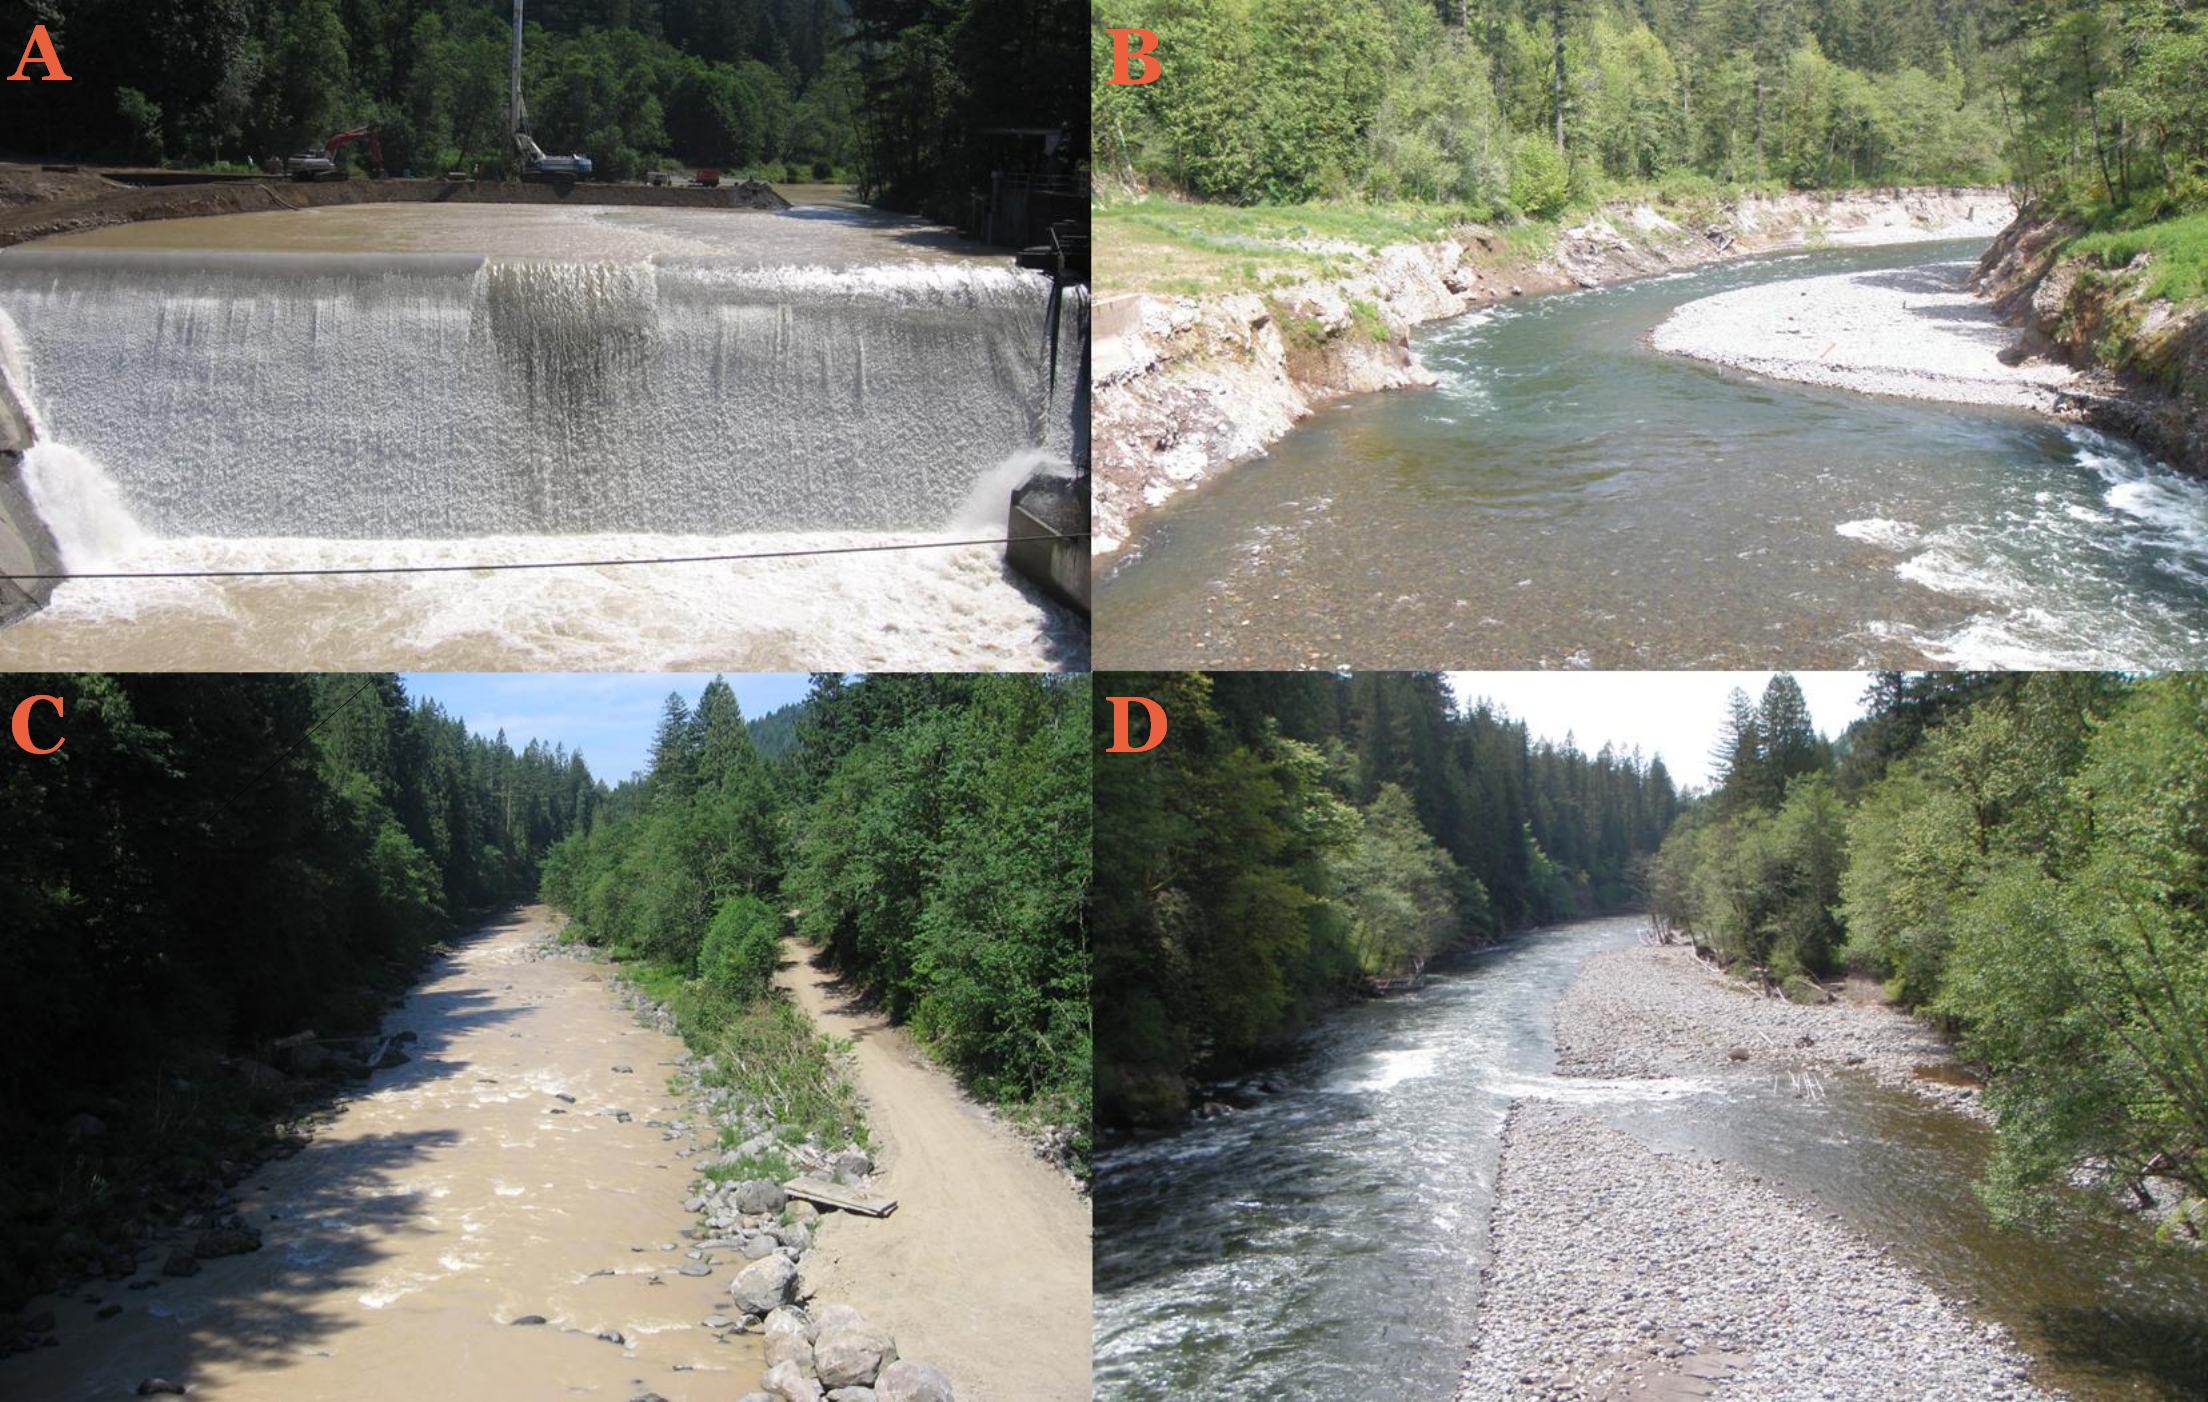
Figure 1: Paired photographs taken from the same location 50 m below the dam site looking upstream (A & B) and downstream (C & D) before removal (A & C) in July 2007 and after removal (B & D) in July 2009. In the July 2007 photo (A) Marmot Dam is still in place and heavy equipment is constructing the cofferdam. The road visible on the right side of the downstream pre-removal photo (C) has been buried by several meters of sediment in the post-removal photo (D).
http://serc.carleton.edu/details/images/18292.html
An Example of One River's Response to a Large Dam Removal - 1 Feb 2011 ... Damming a river can provide hydropower, water storage, and/or flood control, but at the same time may have adverse effects on fish and other ...serc.carleton.edu/vignettes/collection/37741.html - En caché
-
---
.